
Loop Analytics
OVERVIEW
Loop analytics and reporting are found on your Analytics page within the admin.
Using the Overview Dashboard
The Overview dashboard provides you with an overview of your returns data that can be filtered by a number of criteria.
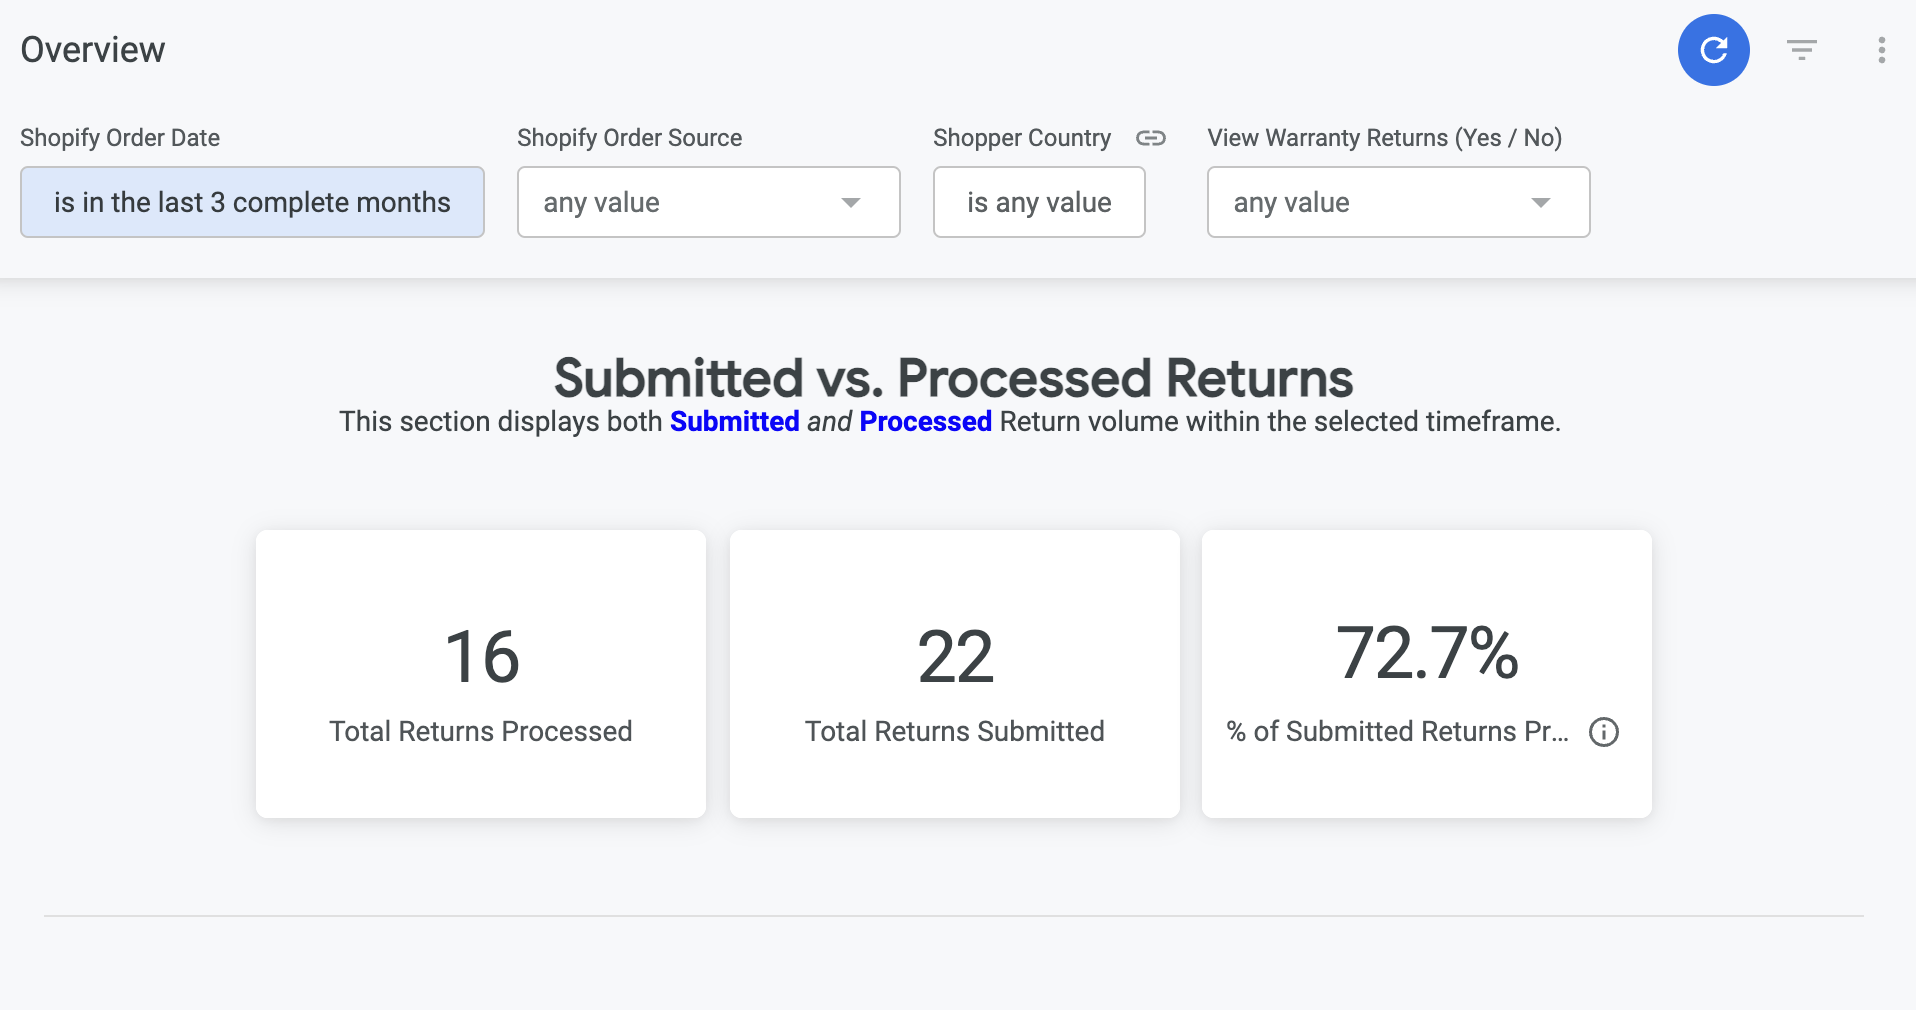
The filters are as follows:
Shopify Order Date: show only returns based on orders created within the specified time frame.
Note: When filtering to a specific time period, Loop is pulling returns processed tied back to orders created in that time frame in Shopify, not returns created in that time frame. For example, filtering down to the last 30 days will show all return data associated with orders placed in the last 30 days, not necessarily all returns placed in the last 30 days.Shopify Order Source: show only returns that match the selected order source.
Shopper Country: show only returns based on orders created by shoppers in the selected countries.
View Warranty Returns: show only warranty returns. For more on warranty orders, see Warranties.
When adjusting the filters at the top of the page, click Reload in the top right of the dashboard to refresh and apply the new filter.
To view a specific metric in the charts, hover over the data point (see below).
To receive more detailed information, click on the data point to view the detailed data that rolls into the data point. Select which level of data you would like to see.
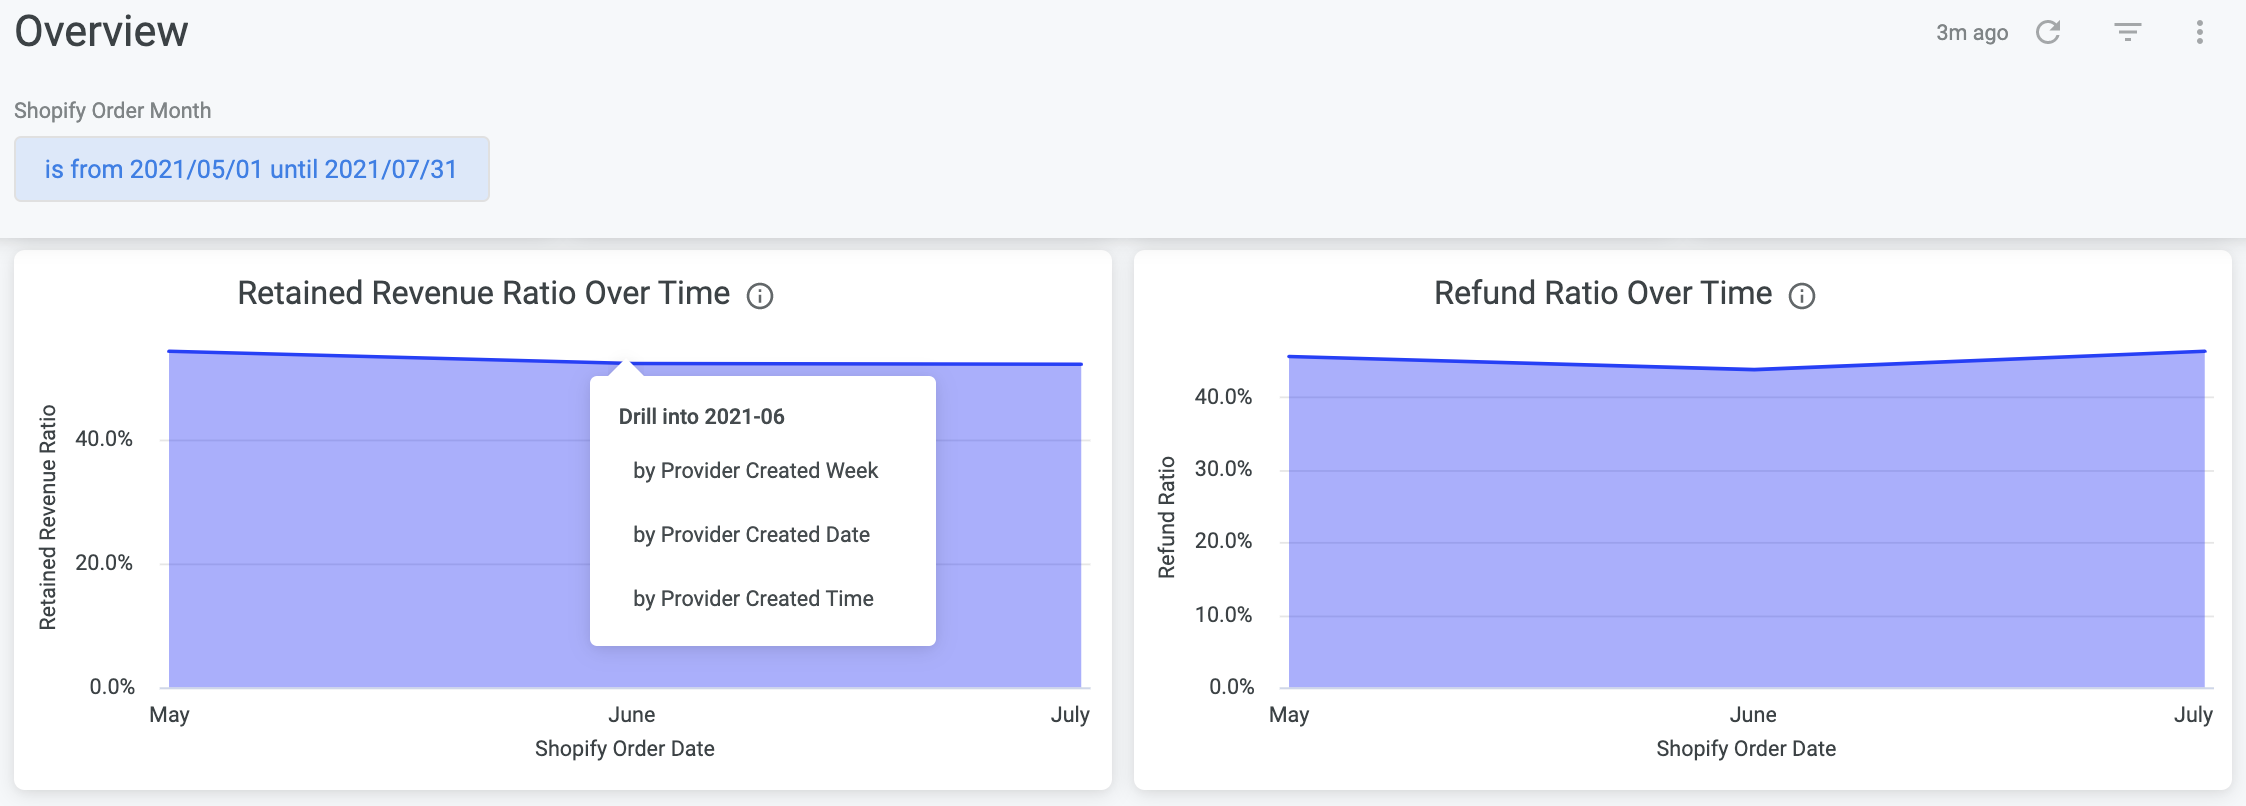
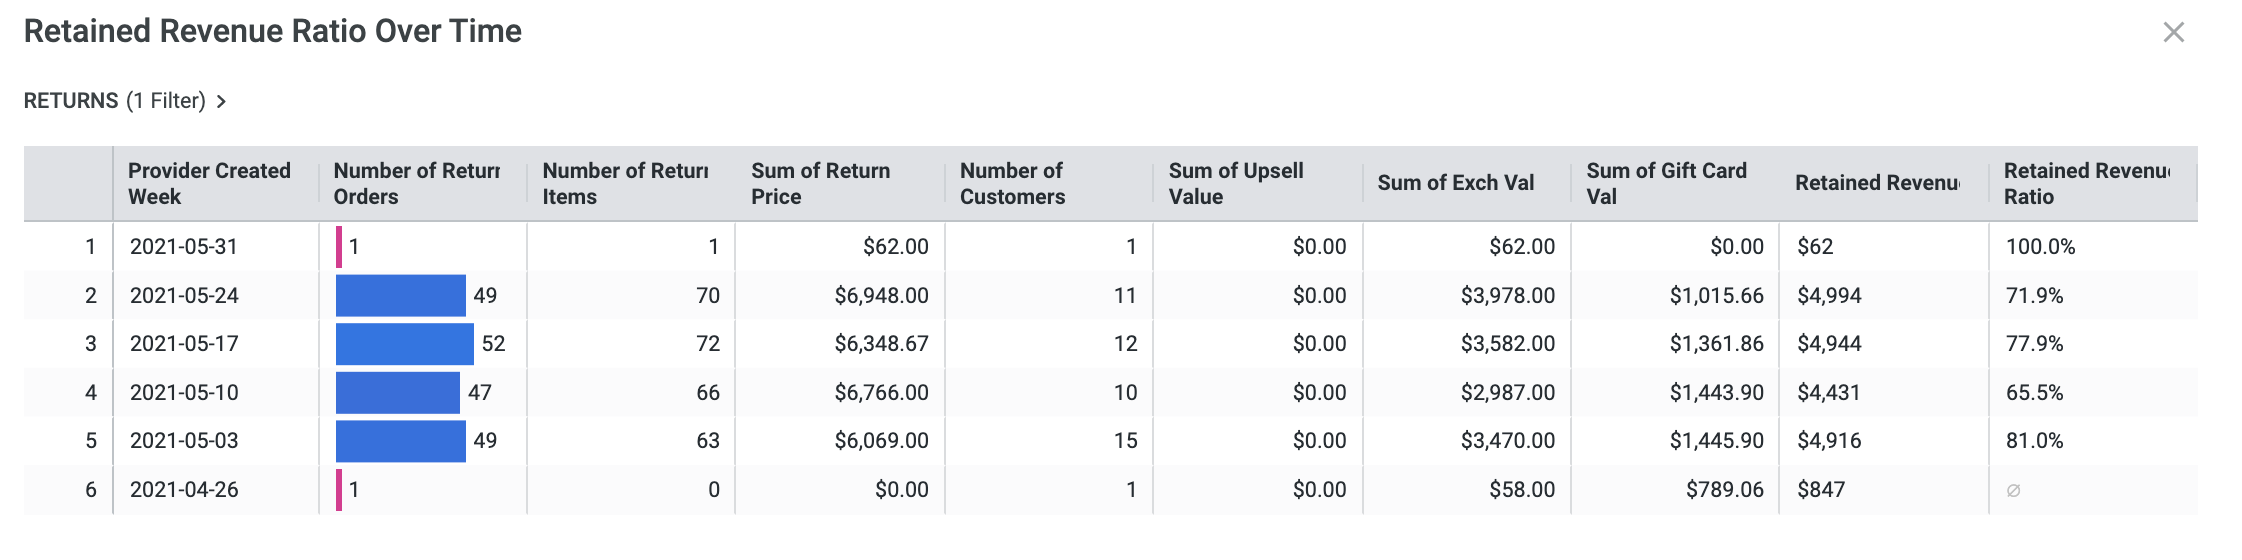
You will receive a pop up that dives into the data point you chose to "Drill into".
Overview Dashboard Sections
The dashboard is broken out into a few sections, which we'll look at in detail here.
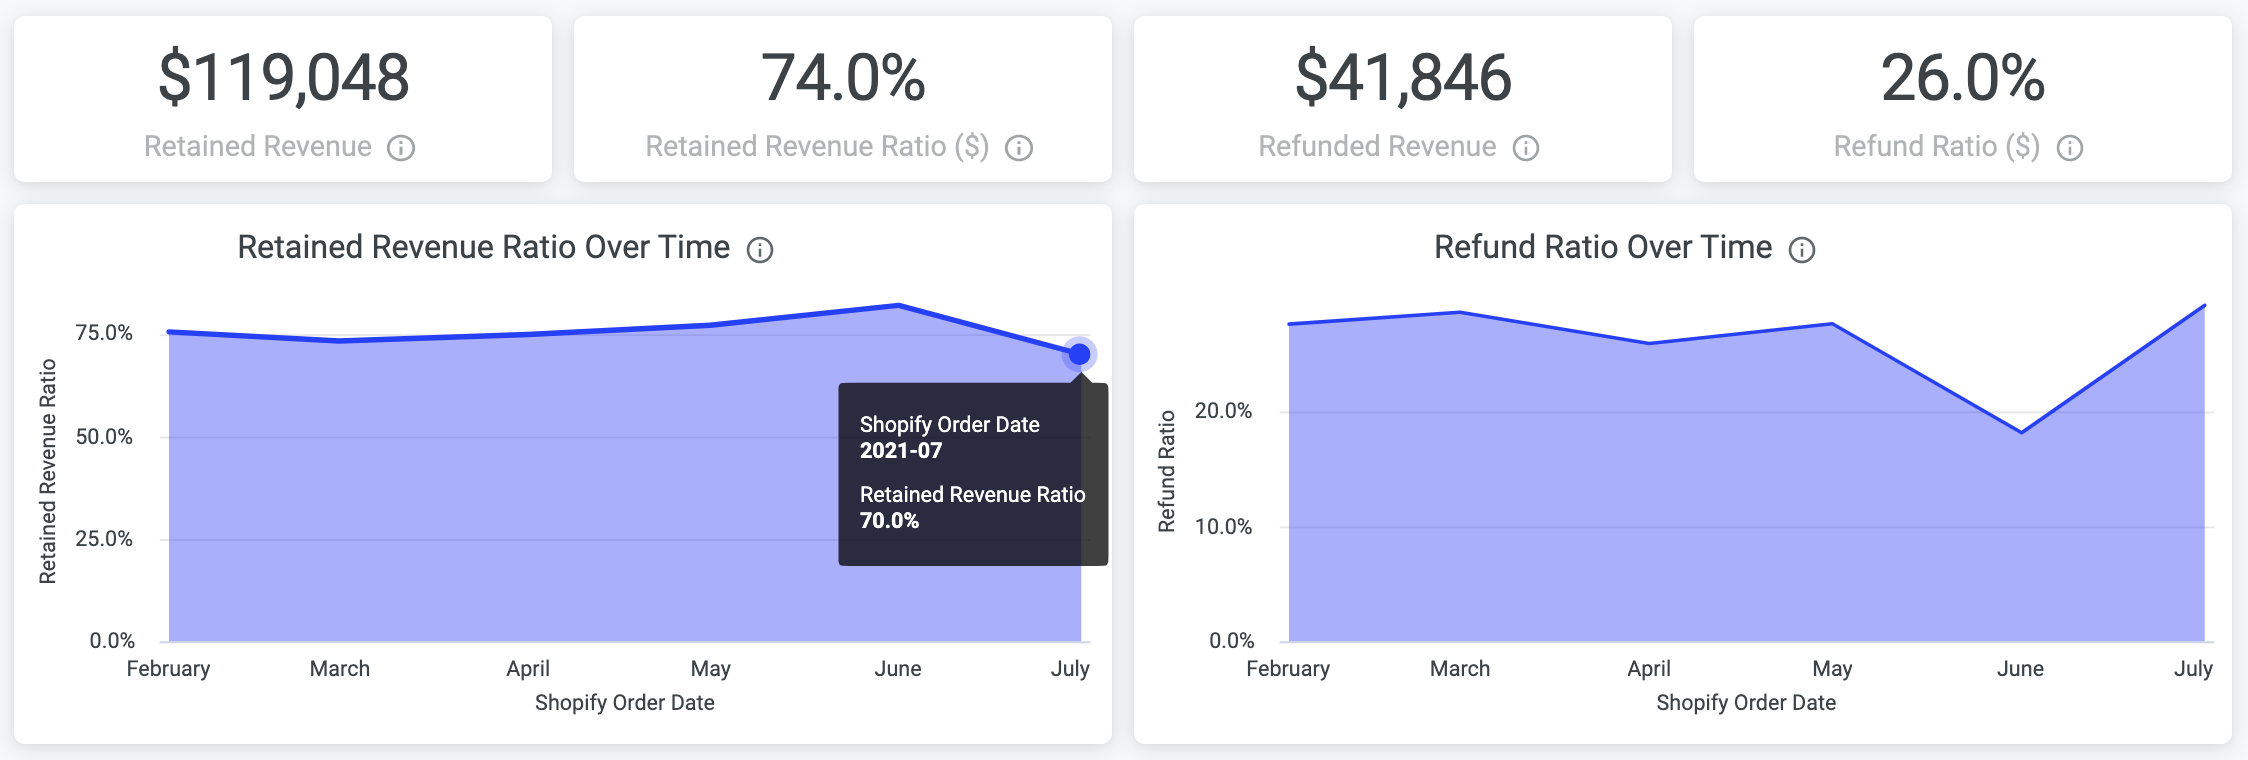
Key Indicators
Loop is a revenue retention tool. This section covers how well you're retaining revenue in the returns process.
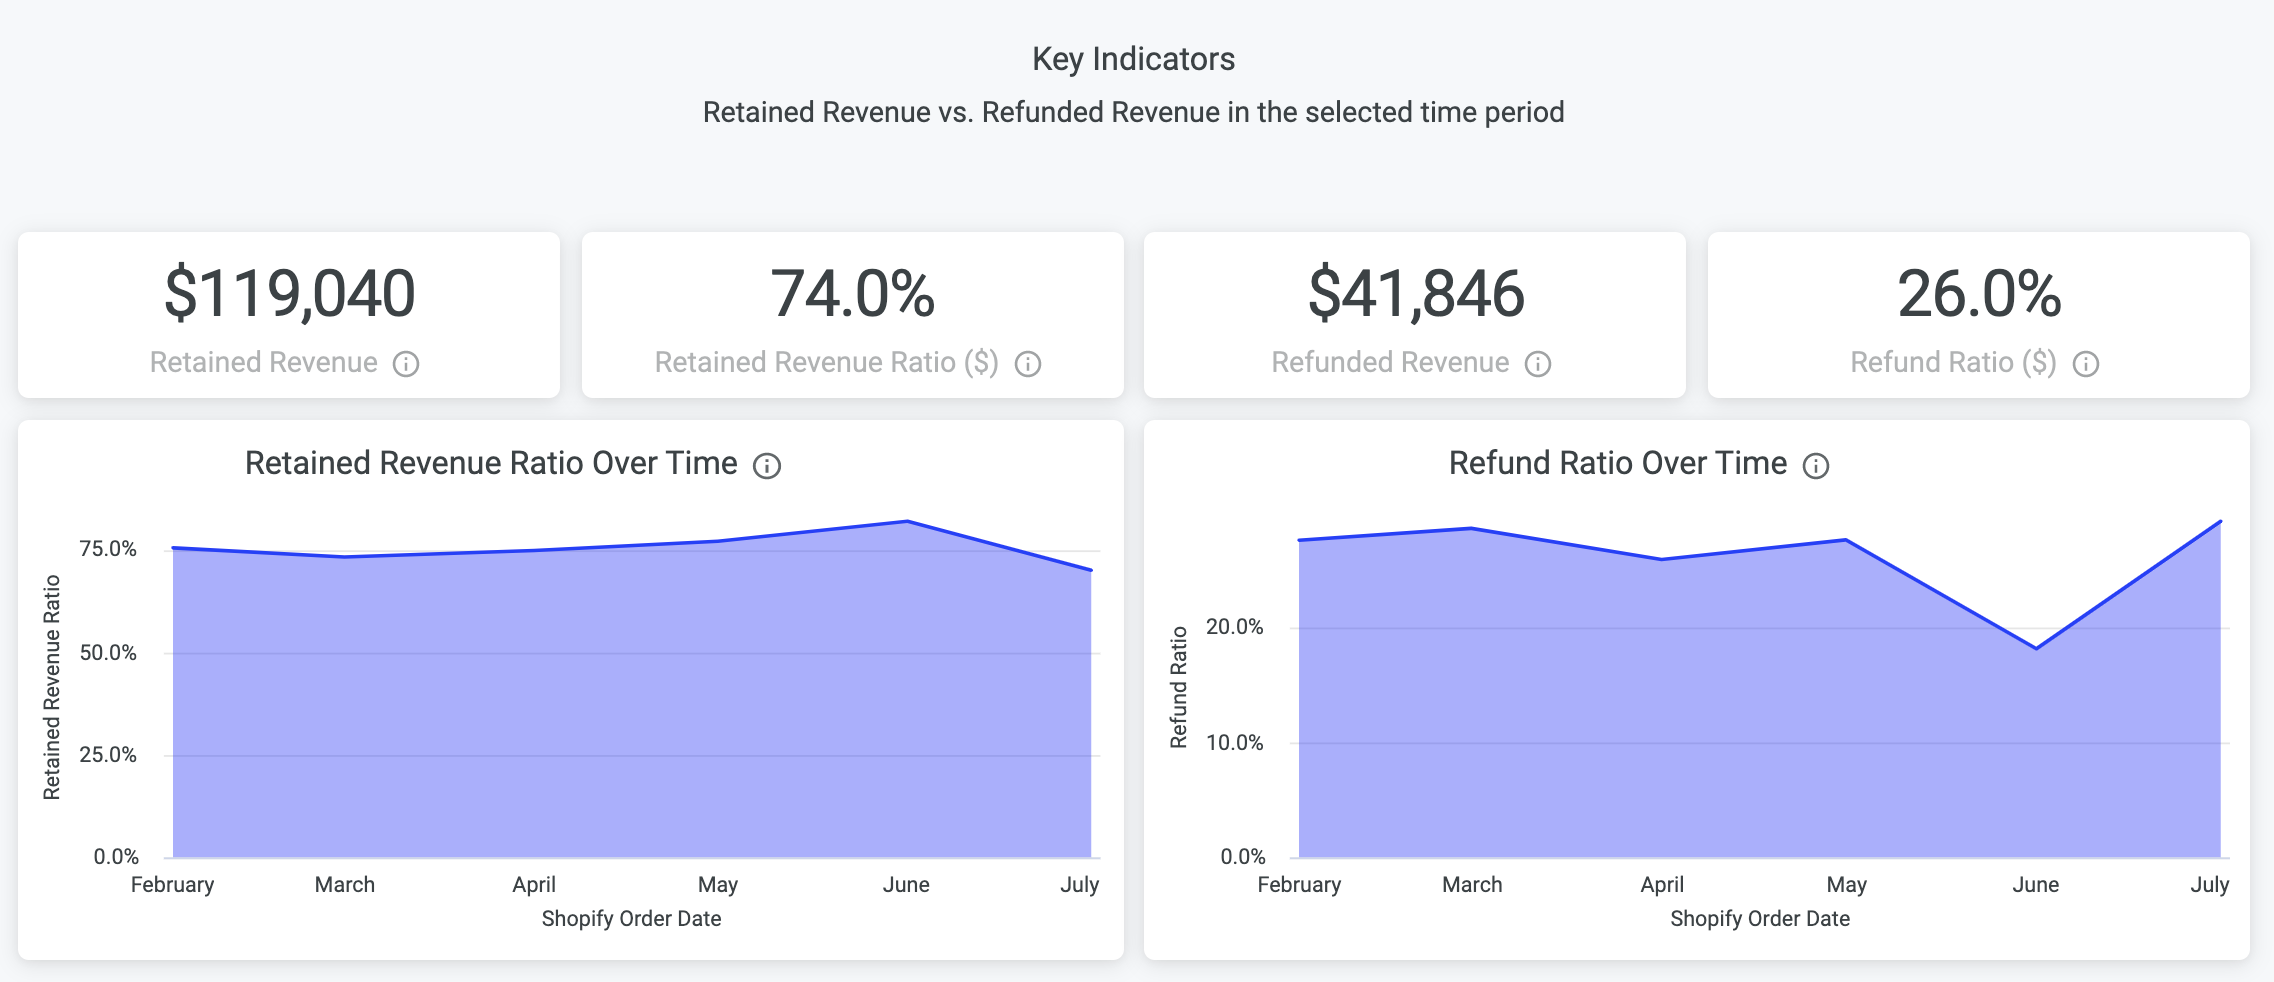
The data points are:
Retained Revenue: total amount of revenue retained, defined here as revenue exchanged (including Shop Now), or issued in store credit
Retained Revenue Ratio ($): retained revenue as a percentage of total revenue returned
Retained Revenue Ratio over Time: the above metric tracked over time
Refunded Revenue: total amount of revenue refunded back to customers
Refund Ratio ($): refunded revenue as a percentage of total revenue returned
Refund Ratio over Time: the above metric tracked over time
Return Rates
Looking at return rate in terms of total revenue, total orders, and total items in Shopify.
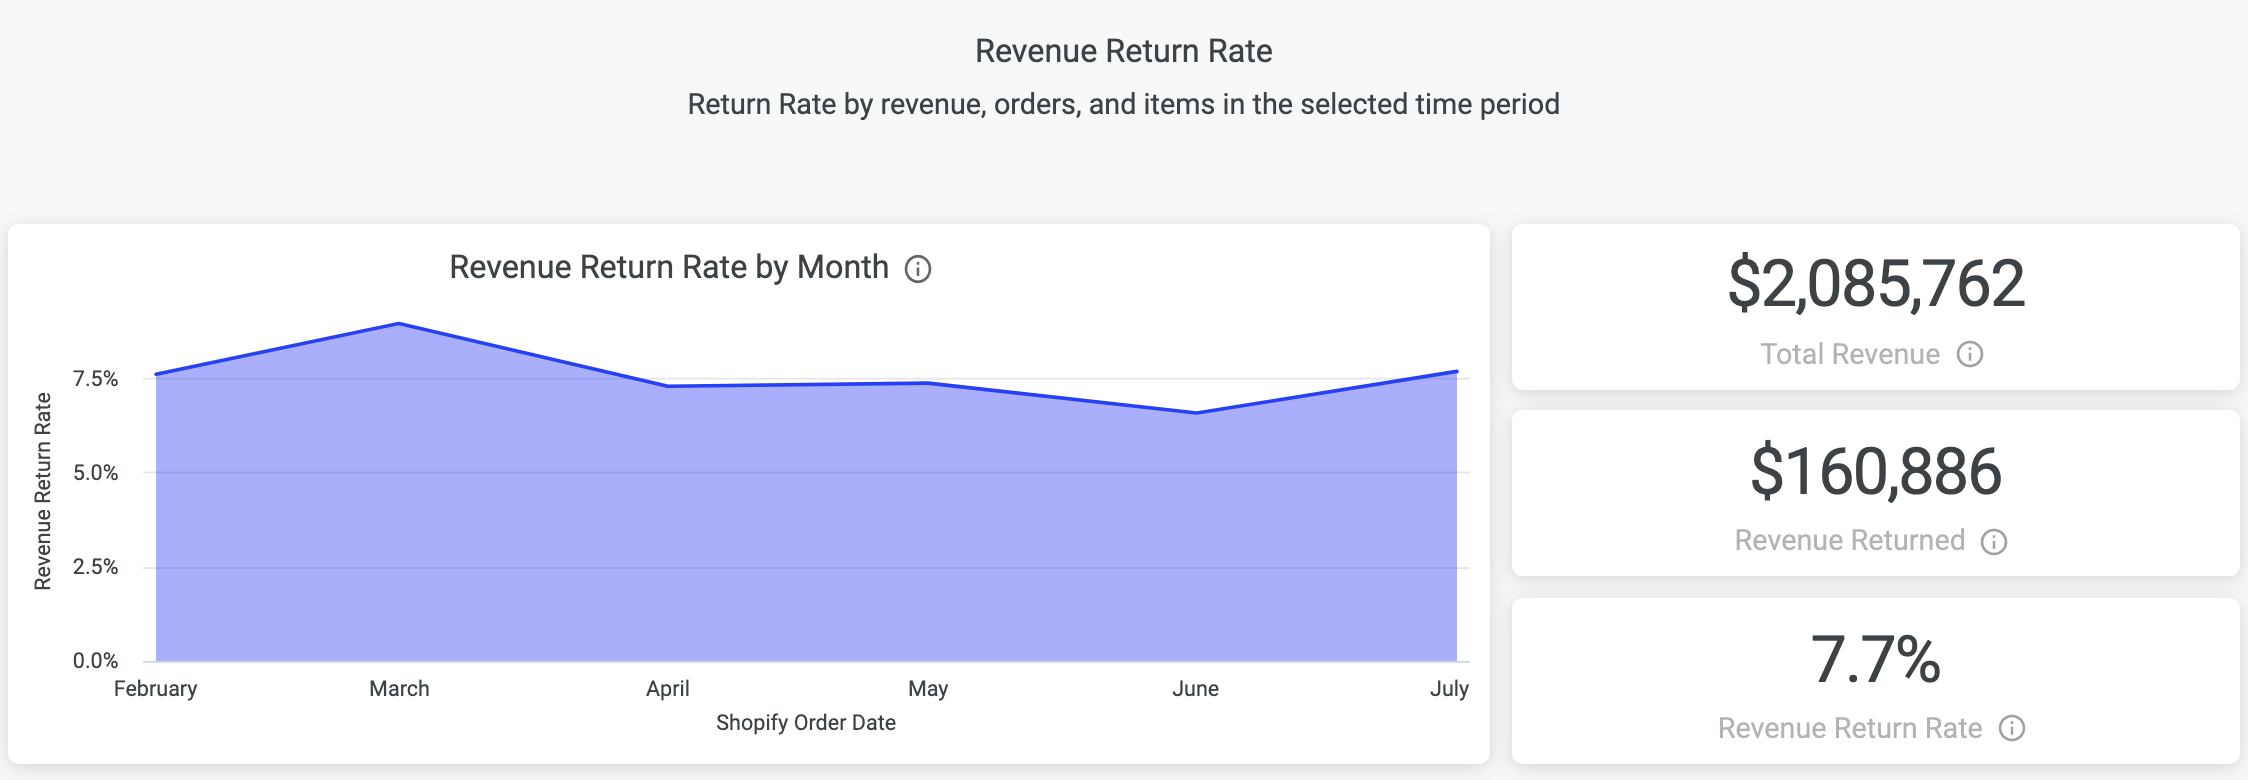

The data points are:
Total Revenue: total revenue pulled from Shopify
Revenue Returned: total revenue returned through Loop
Revenue Return Rate: returned revenue as a percentage of total revenue
Revenue Return Rate by Month: the above metric over the past 6 months
The same metrics exist here in terms of:
Total orders in Shopify and orders returned
Total items purchased in Shopify and items returned
Outcome Performance
Looking at how your various outcomes (exchanges, store credit, Shop Now) are performing.
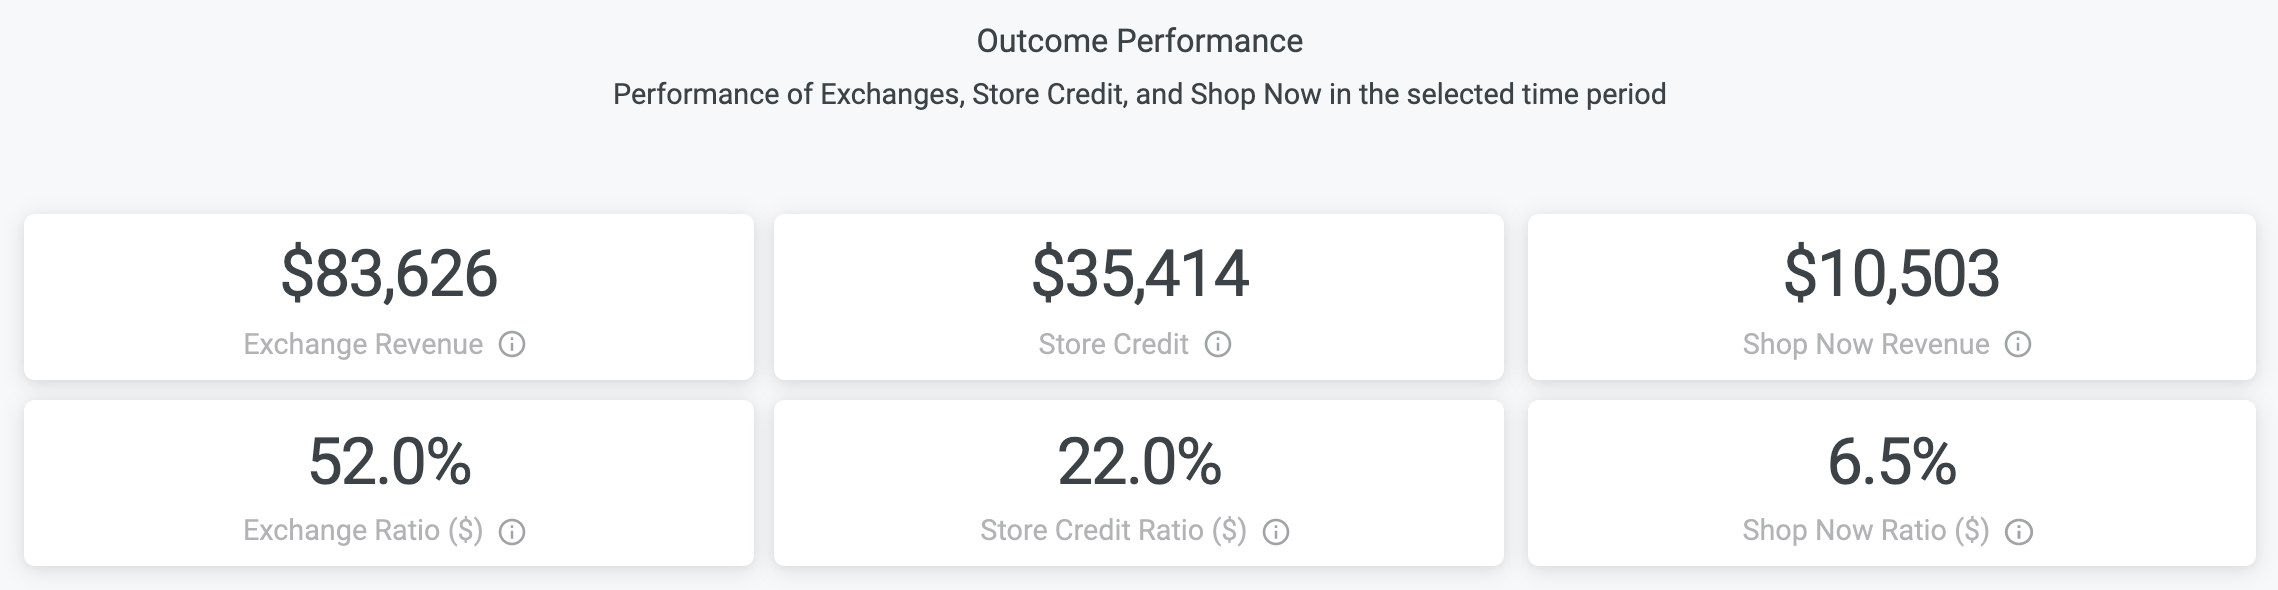
The data points are:
Exchange Revenue: total revenue exchanged
Exchange Ratio: total exchanged revenue as a percentage of all returned revenue
The same metrics exist for store credit and Shop Now outcomes.
Upsell Performance
How effectively are you leveraging returns as a revenue generator? Merchants not using Shop Now will see all zeroes.
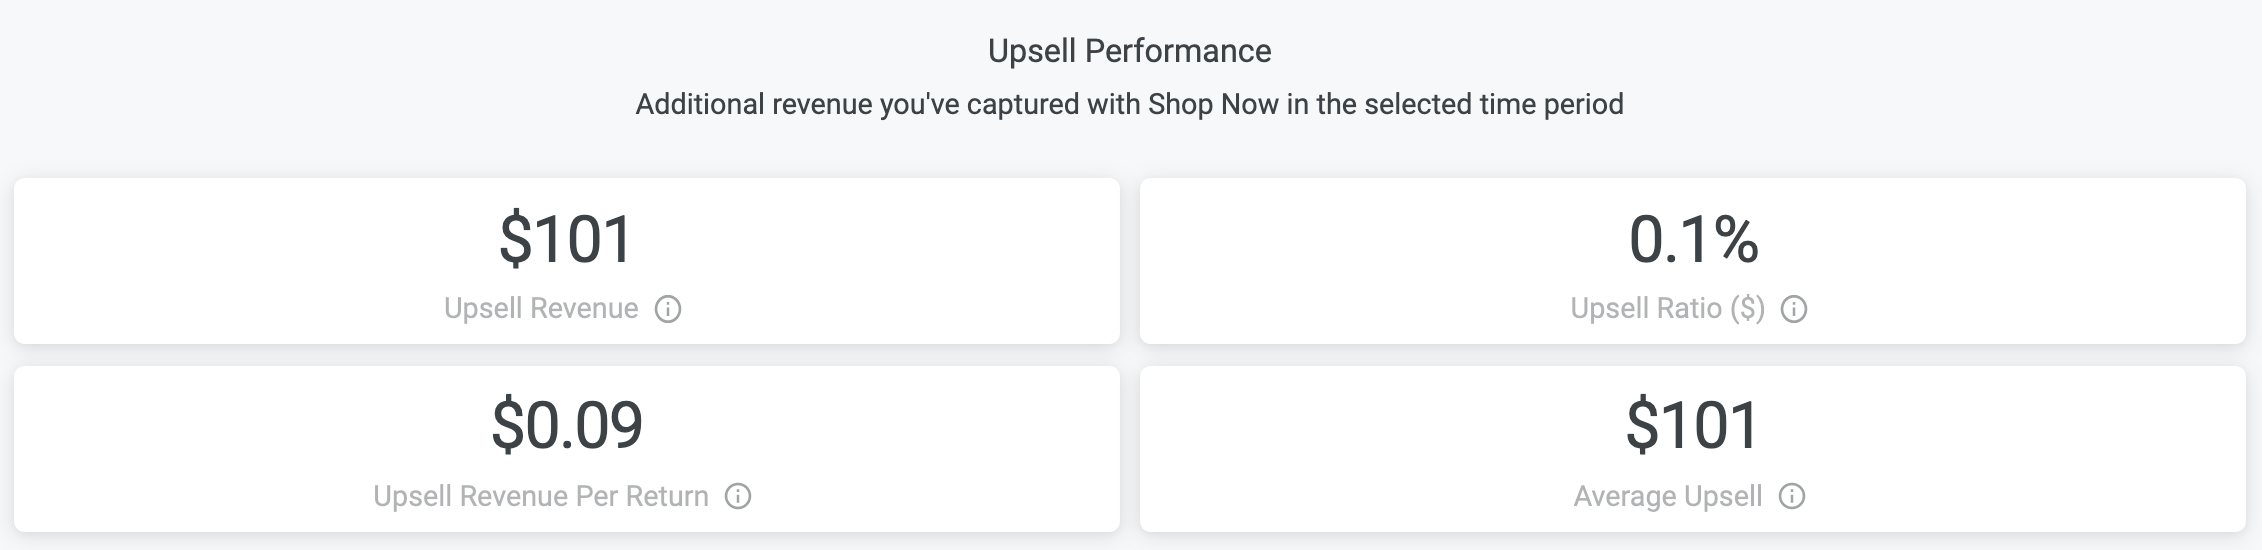
The data points are:
Upsell Revenue: total revenue generated through upsell in Loop
Upsell Ratio: number of returns with upsell as a percentage of total returns processed
Upsell Revenue per Return: total upsell revenue generated divided by all returns; in short, how much money are you making per return across all returns
Average Upsell: average upsell amount across all upsell returns
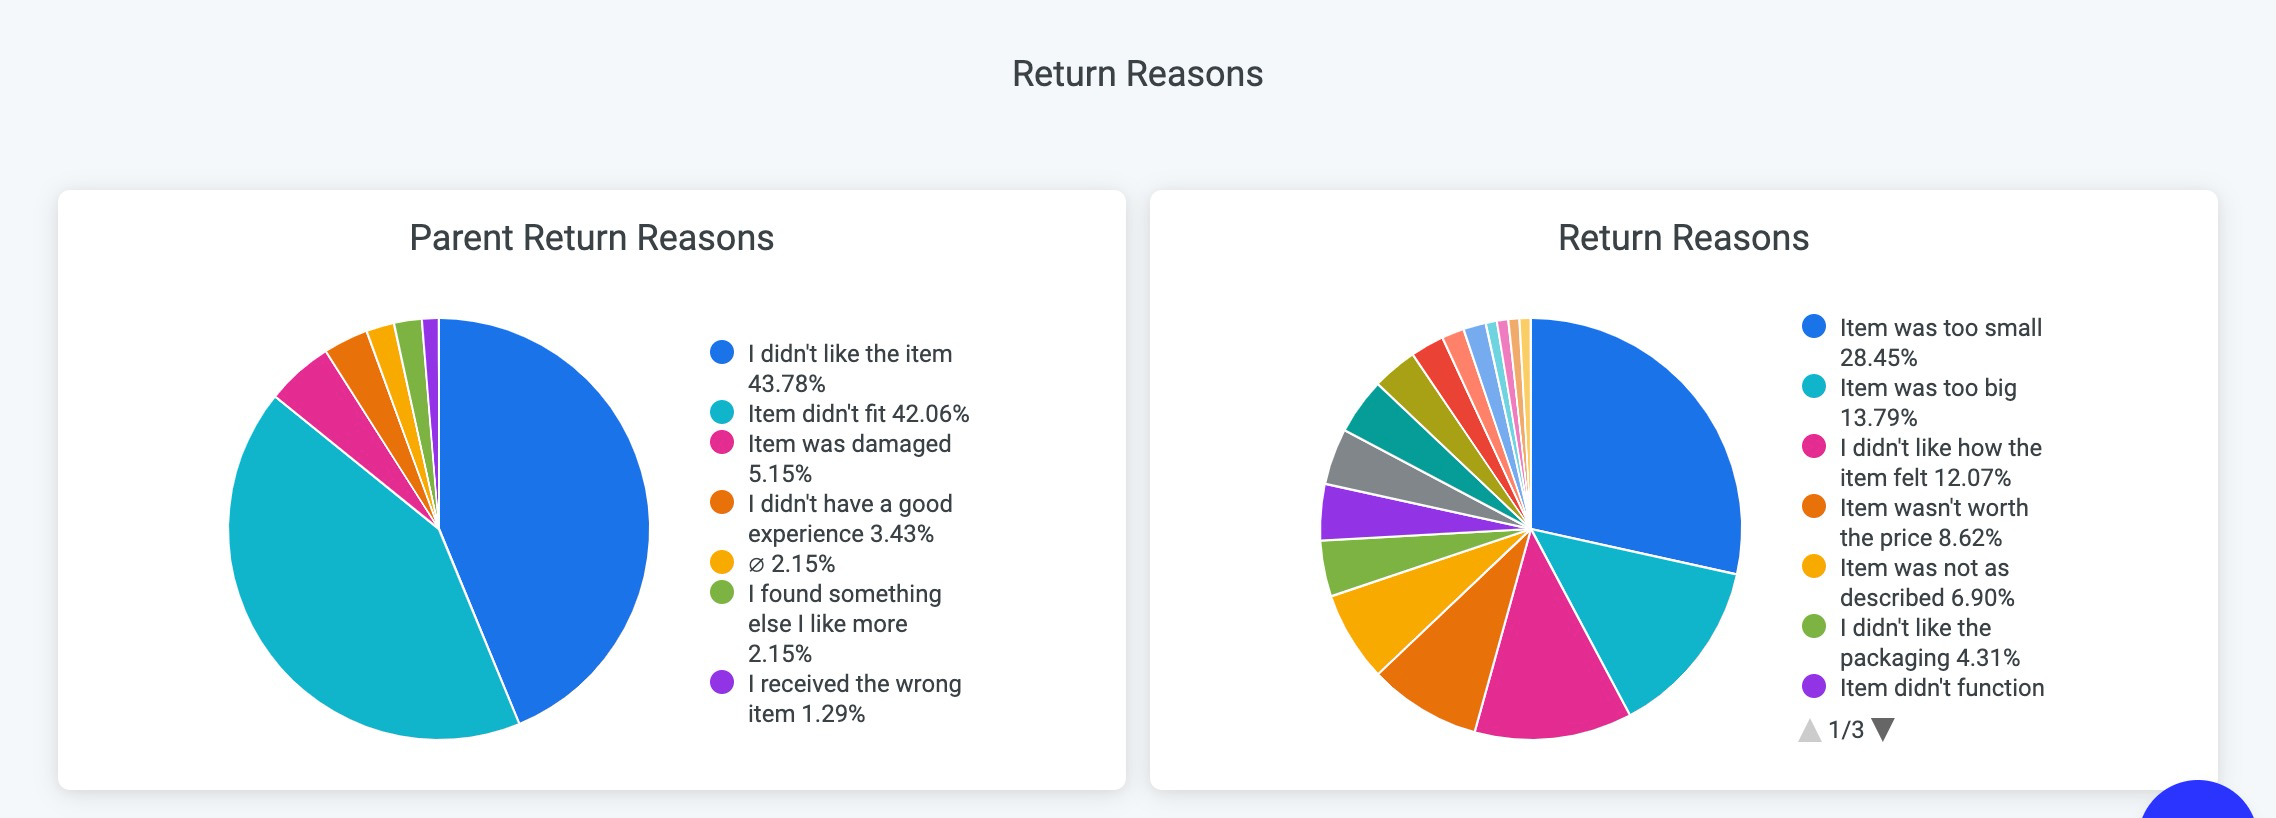
Returns Performance
High level overview of the tops reasons products are being returned.
FAQ
How can I have the warehouse ASN report automatically sent to my warehouse? This is a Plus plan feature that requires an integration with API access. Please contact your Onboarding/Account Manager or support@loopreturns.com if this is something you're interested in.
Why isn't my report loading? Reports will fail to load if the data set is too large. If you encounter this issue, please narrow the date range and try again. If you have narrowed the date range and the report is still failing to generate, please contact support@loopreturns.com.
Can I download the reports in the Overview tab? Not right now. For the time being, we recommend merchants leverage the existing reporting in the Reports tab for downloading data.
What time zone is Loop reporting in? Adjustment reports reflect the time zone on the Shopify store but the rest of the reports are in GMT.
What currency is displayed in Loop reporting?
Loop reporting displays the totals in your store's default currency as it's configured in Shopify. The figures will always display with a $ sign, but please disregard this if you have a non-USD default currency.
Please reach out to support@loopreturns.com with any additional questions.