
Advanced Analytics
OVERVIEW
Advanced Analytics is a powerful combination of order data and returns data broken out into 3 categories - Product Insights, Customer Behavior, and Operational Insights. This can be found in your Loop Admin under Analytics.
To check to see if this feature is included in your plan, please review the Pricing page on the Loop Returns website. If you're interested in this adding this feature, please contact your Merchant Success Manager or support@loopreturns.com.
Value Impact
Better understand how Loop is impacting your business overtime by certain key metrics.
Understanding the Data
All return values are based on submitted returns in Loop.
All currency values are in your default Shopify shop currency.
The dashboard begins with Return Outcomes over the last 4 quarters to allow easy identification of seasonal trends and the impact of business decisions on return outcomes.
Value Impact Data Points:
Retained Revenue = Total return value from Exchanges and Store Credit return outcomes, not including Upsell.
Upsell New Revenue = Total value from Upsell on returns.
Recouped Label Fees = Total value of handling fees charged to customers.
CX Time Savings = Estimated amount saved by not needing to manually process returns. Assumes one full-time employee at $15/hour processes 10 returns per hour.
Keep Items Savings = Estimated amount saved by allowing customers to keep an item and not having to process those returns.
Targeted Users: CX Leaders, Operations Managers, Merchandisers, Business Owners
Product Insights
Reduce your return rate with deeper insights into top returned products, top return reasons, and trends over time.
Understanding the Data
All data in the Products dashboard ties back to when the order was placed in Shopify.
Order data (Total Units Sold, Total Shopify Orders) covers ALL Shopify orders including in-store and Point of Sale (POS).
Returns data only includes returns submitted via Loop.
Product Descriptor drop-down changes the aggregation level in the Product Performance Summary section, providing the ability to view metrics at different levels of granularity.
Product Insights Data Points:
Item Return Rate = Number of Return Items / Total Units Sold
Item Exchange Rate = Number of Exchange Items / Number of Return Items
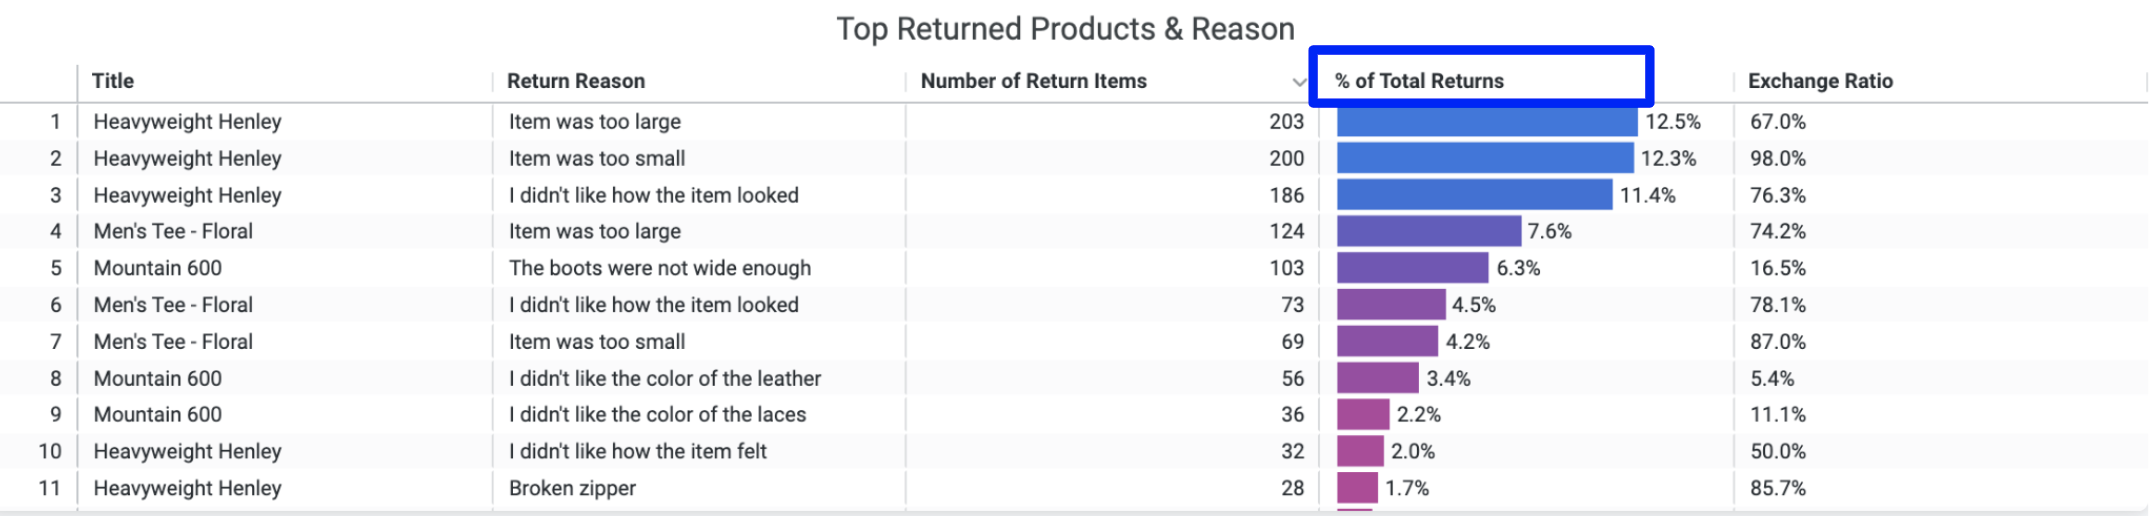
% of Returns = Return reason count by product / Total Number of Returns by product
Secondary Purchase Rate = A measure of how often a specific product led to a subsequent order by the same shopper.
Total Subsequent Orders by Product / Total Number of Orders by Product
Note: The Subsequent Order does not need to contain the product in the original order.
Loop Product Rank = Loop Rankings of merchant products based on Product Metrics (Item Return Rate, Items Sold, Item Exchange Rate, and Secondary Purchase Rate).
The rank is calculated by first assigning a percent rank (0% - 100%) to each metric for a product in the table compared to other products (i.e. a ‘higher’ ranked metric across products will be represented by numbers closer to 100%).
Products are then ranked using the weighted average of these ranked metrics in the following order from highest to lowest weight.
Items Sold
Secondary Purchase Rate
Item Return Rate
Item Exchange Rate
Use Cases
Targeted Users: Operations Managers, Merchandisers, Business Owners
Update Product Descriptions to ensure customers purchase the right variant the first time.
Share with Product Development teams to adjust sizing to reduce returns.
Identify reasons why certain products are bringing customers back.
Quickly identify product performance based on multiple metrics.
View which Vendors and Product Types are over- or under-performing.
Adjust the manufacturing process to improve quality & fit.
Drill down to see customers' specific issues with variants and sizing.
Monitor results & progress to reducing returns over time.
Customer Insights
Identify your best customers and your most costly customers by segmenting your data via average order value, return frequency, refund ratios, and more.
Understanding the Data
Data in the Returns Outcomes dashboard is driven by orders placed within the specified date range.
The remaining dashboards are based on customer data within the specified date range. (For example: a range set to "is in the last 12 months" will pull in orders and returns from customers from the last 12 months).
Customer Behavior Data Points:
Return Rate = Total Returns Orders in Loop / Total Shopify orders
Return Outcomes over time - view the breakout between refunds, store credit, and exchanges (includes Shop Now outcomes)
Total Customers - quantity of unique customers who have purchased during the specified timeframe
Average Days to Second Order - average time between customers' first and second orders
Orders per Customer = Total number of orders / total customers
Average Order Value = Total sales / number of orders
Total Spend per Customer = Total Shopify sales / Total customers
A+ Customers - Top 5% of customers by order volume, with <=20% return rate
Costly Customers - Top 5% customers by number of returns, with >50% refund ratio
Use Cases
Targeted Users: CX & Marketing Leaders, Business Owners, Operations
Customers with a Loop return vs. without a Loop return
Adjust return policy to encourage returns for dissatisfied customers.
Use data to forecast the ROI of retention marketing campaigns.
Quantify the value of Loop to justify annual contract value.
A+ Customer data
Identify & tag best customers to run targeted campaigns.
Reach out to your best customers to turn them into brand advocates.
Model the behavior of your best customers to convert average customers to best customers.
Costly Customer data
Adjust return policy to reduce the number of costly returns.
Create win-back campaigns to encourage A+ behavior from this segment.
Bonus & Keep Item tracking
Identify "bad actors" and customers who are abusing the returns policy. Consider using Loop's blocklist functionality to prevent future bad behavior.
Operations Insights
Make your return process more efficient by understanding average processing times, shipping times, label costs, and more.
Understanding the Data
All data in the Operations dashboard are based off of when the return was submitted..
Use Cases
Targeted Users: Operations and CS teams
Track the incoming return volume to make staffing decisions and reduce processing time.
Track processing times to model and forecast customer service demand.
Use the average label cost per Carrier to negotiate rates and reduce costs.
Track the status of return labels to plan staffing and warehouse capacity and improve efficiency.
Identify stuck return labels to resolve potential CX issues before it impacts my customer.
Understand which members of your team are processing the most returns to direct team resources more efficiently.
Shipping & Logistics
Better understand your logistics costs and how carriers are performing.
Understanding the Data
All data is based on submitted returns in Loop.
All currency values are in your default Shopify shop currency.
Shipping Cost is calculated using Label Rates for Box & Ship and the per item fee for Happy Returns through Loop.
Shipping & Logistics Data Points:
Shipping Costs = Total sum of how much return labels are costing you.
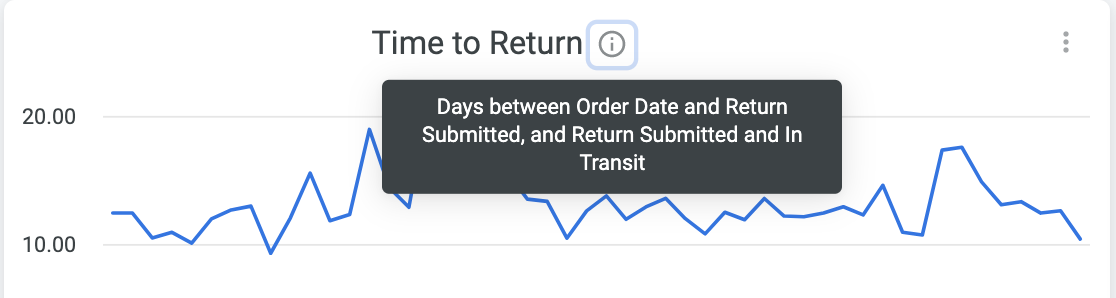
Cycle Times = Average days it takes for returns to get to in-transit, processed, and delivered events.
Carrier data = Shipping costs, Cycle Times, and Delivery Issues broken down by carrier and carrier service.
Fee data = Total sum of how much money you’re collecting from handling fees, broken down by refunds, exchanges, and store credit.
Use Cases
Targeted Users: Operations Managers, Business Owners
Understand how different carriers and carrier services compare to each other to influence your carrier strategy.
Understand how much you’re spending on return labels vs collecting from handling fees to influence your fee strategy.
Track how long it takes for returns to get back to certain statuses and improve forecasting for receiving returns.
Tips for using the Dashboards
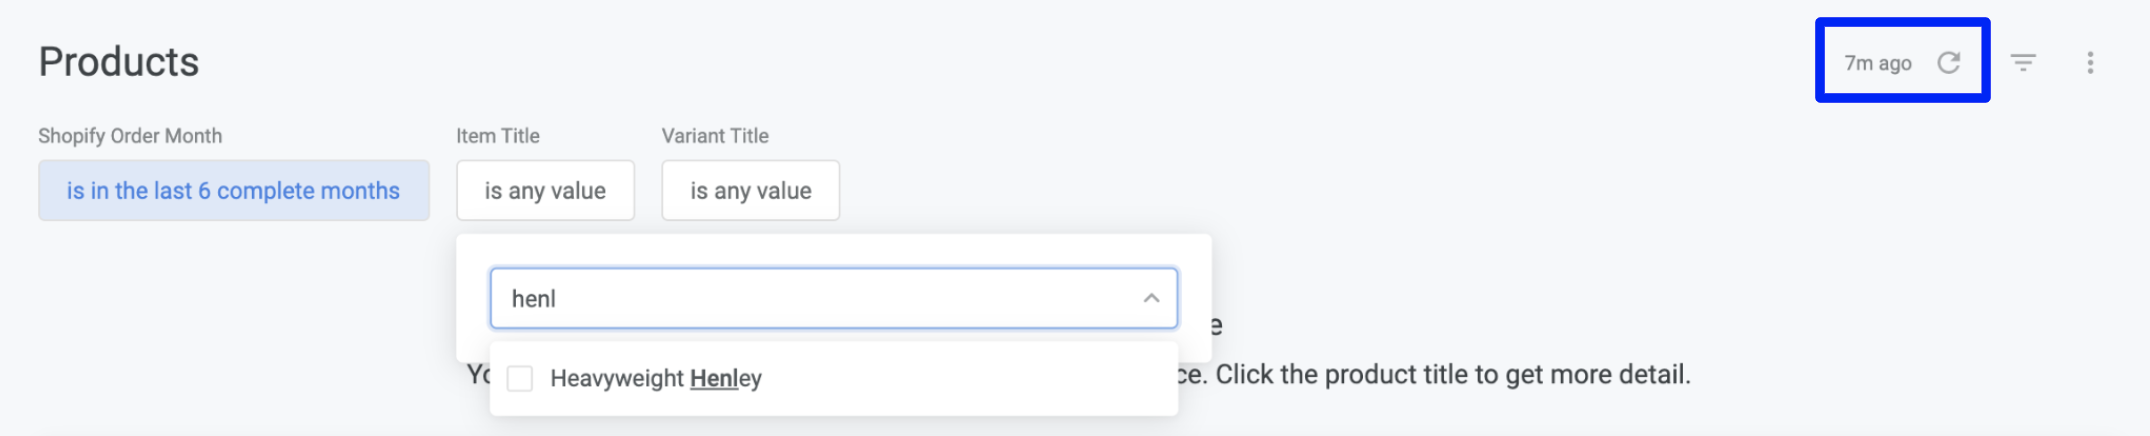
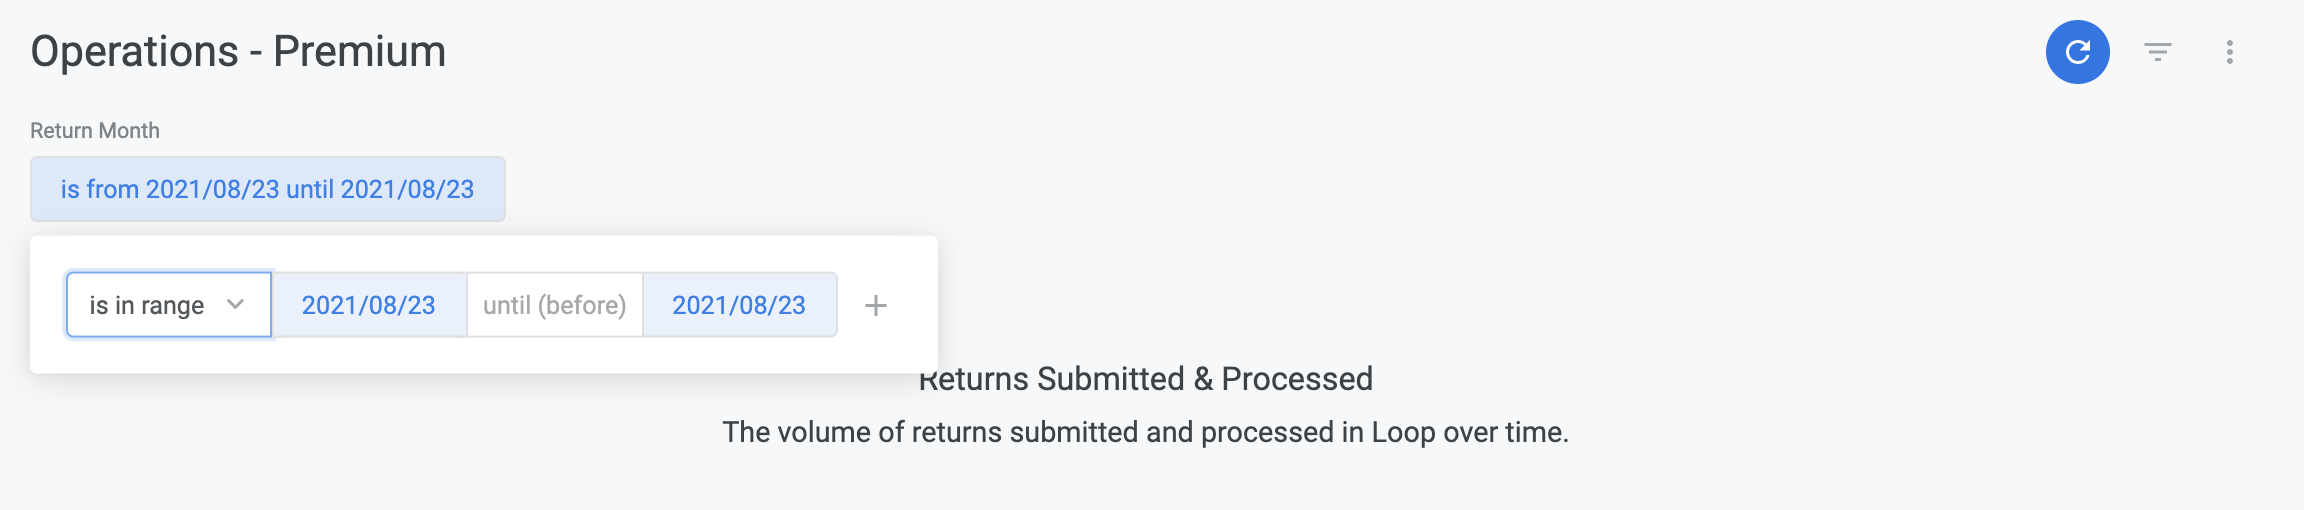
Filter the data by updating the available fields at the top left of the dashboard. Click the Reload button in the upper right hand corner to refresh the data.
Look at a specific date range by using the "is in range" option.
Sort the data by clicking on the column headers.
Each dashboard's data can be downloaded by using the Vertical Ellipses button on the top right hand corner. This will allow you to export the data to Excel, CSV, TXT and more.
Note: The ability to download the data will not be available during the free trial through September 10, 2021.

Learn more about the data points shown by clicking on the Information Symbol. These contain information on what the data point is or how the data point is being calculated.
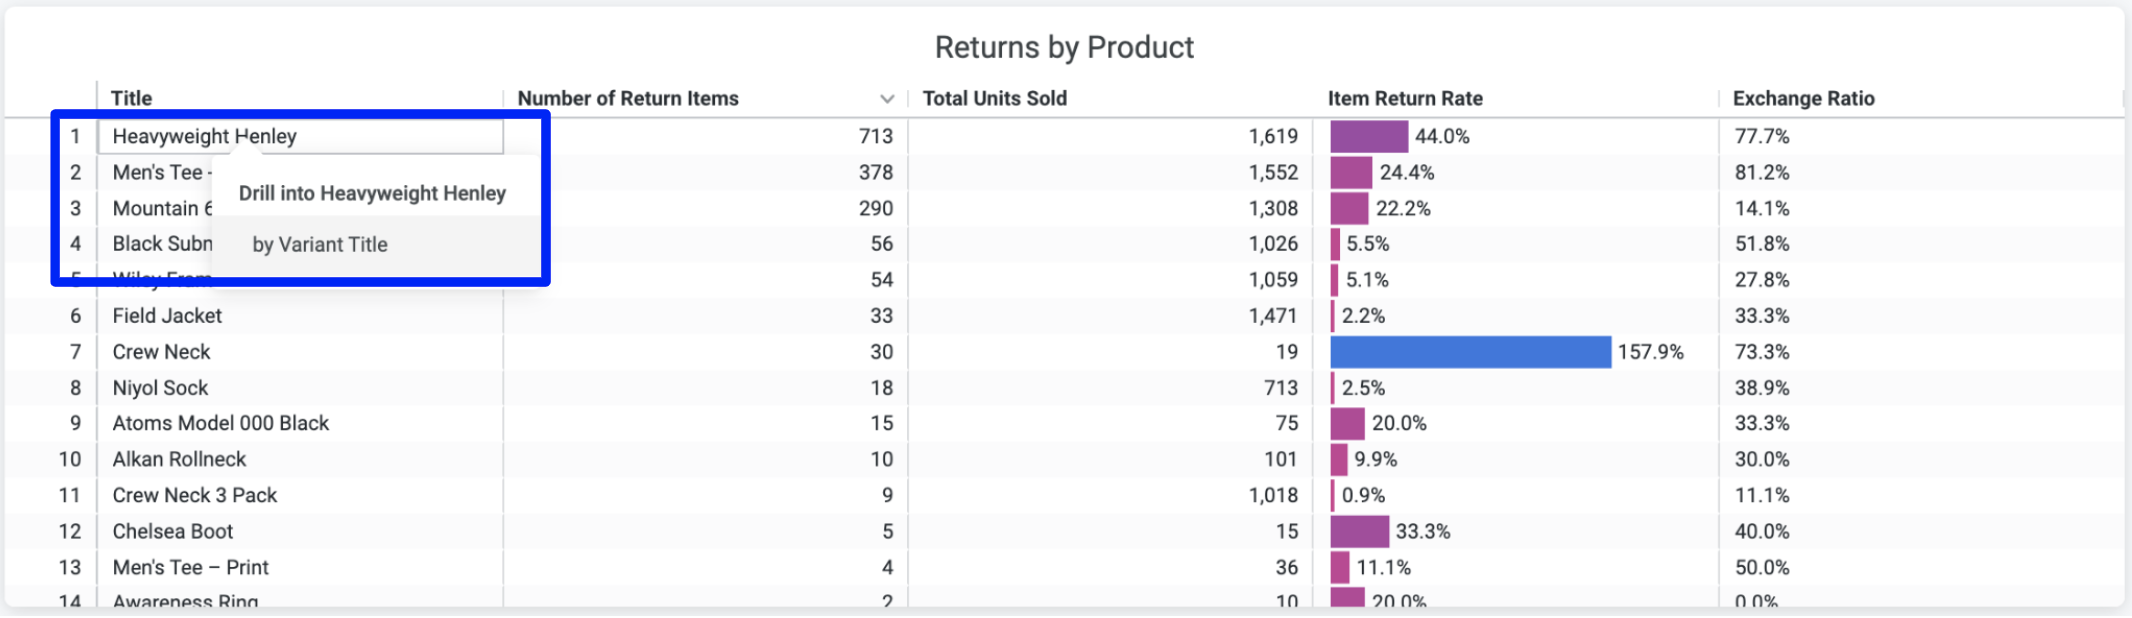
On the Product Dashboard - learn more details about specific variants by clicking on the product name under the Title column. Click "by Variant Title".
This will break out number of exchanged items and number of refunded items at the variant level.
Please reach out to support@loopreturns.com with any additional questions.