
Return Prediction Dashboard
OVERVIEW
This article provides information on the two predictive views of the Return Prediction Dashboard - Predicted Item Returns and Orders at Risk of Return. It overviews how to access this dashboard and the information that can be found in each view.
Use the menu on the left to quickly navigate this article.
Predicted Views
Loop's Return Prediction Dashboard provides merchants with forward-looking insights into return activity, allowing them to anticipate and plan for upcoming return volume.
The dashboard includes two predictive views:
Predicted Item Returns – a monthly forecast of expected return volume.
Orders at Risk of Return – a table highlighting specific orders that have a high likelihood of being returned.
This information helps merchants better plan for restocking, customer outreach, and operational forecasting.
Predicted Item Returns
The Predicted Item Returns section provides merchants with a monthly forecast of expected return volume.
Example of the Return Prediction Dashboard:
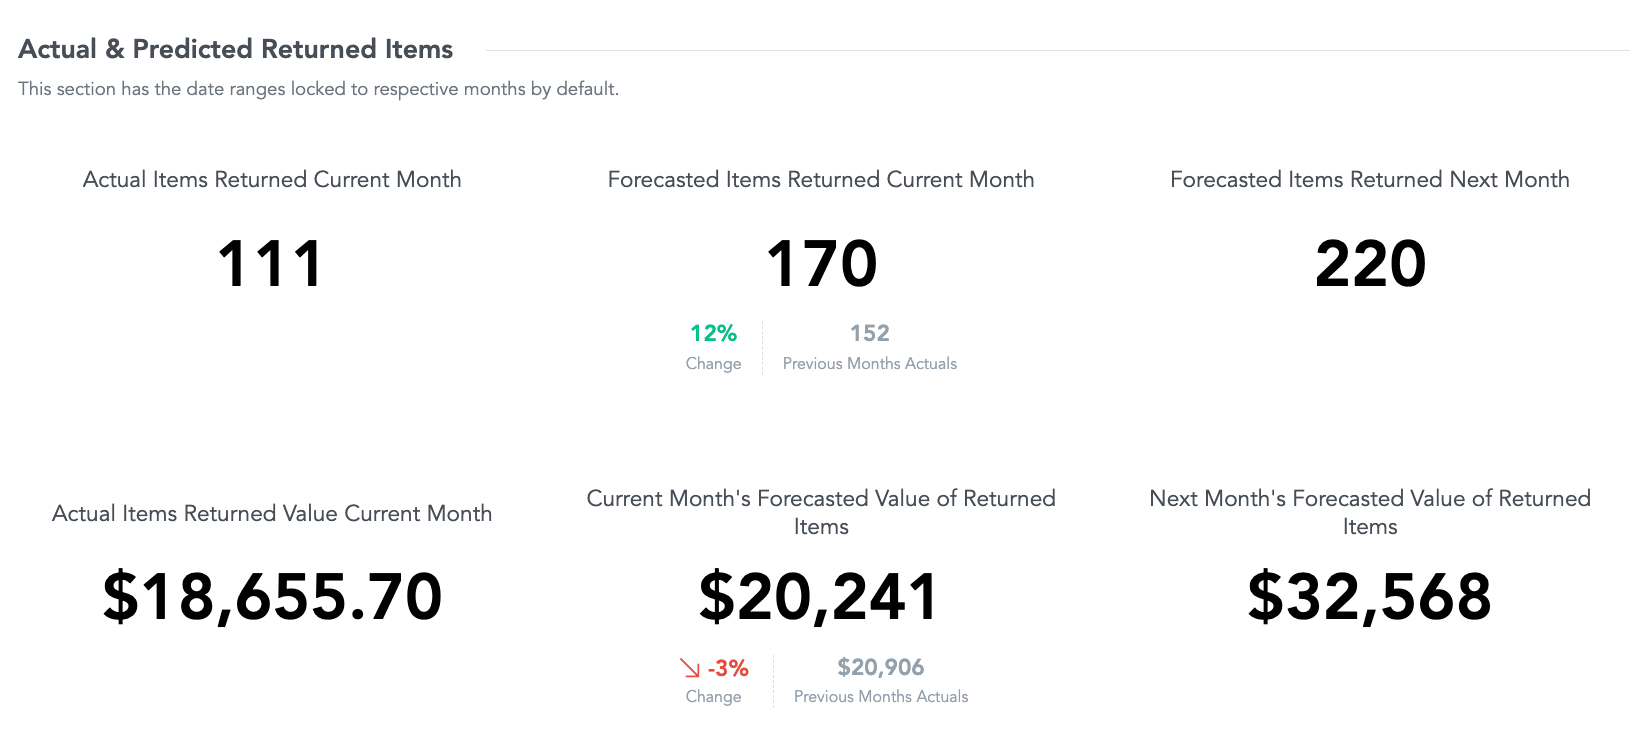
Metrics displayed:
Actual Item Returns Returned– Total count of items that were returned during the month, based on returns submitted by shoppers.
Forecasted Number of Item Returns – Predicted total count of items expected to be returned in the upcoming months.
Actual Items Returned Value – Total value of items that were returned during the month, measured in the merchant's currency. This reflects item prices at the time the return was submitted, not the refunded amount.
Forecasted Value of Returned Items – Predicted total value of items expected to be returned, measured in the merchant's currency.
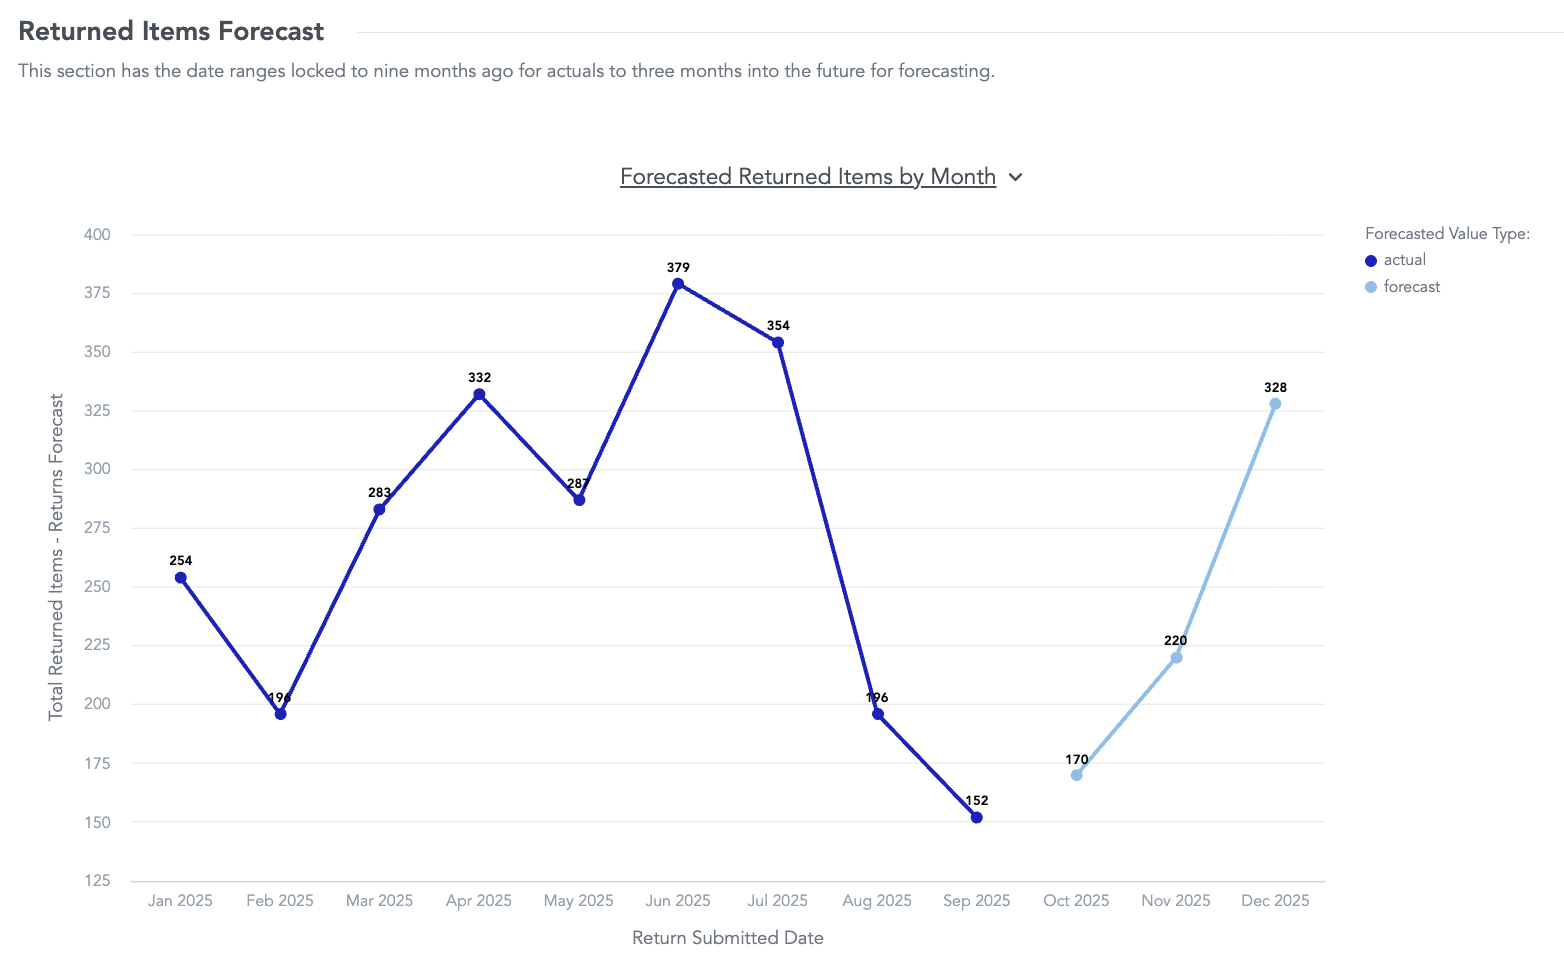
Graph: Returns by month
The line graph visualizes return trends over time, combining historical performance with forward-looking forecasts.
Dark Blue line: Actual item return volumes or value from completed months.
Light Blue line: Model-generated item return forecast volumes or value for upcoming months.
X-axis (Month): Indicates when returns are expected to be submitted.
Forecast frequency and data refresh
Forecasts are generated monthly, on the first of each month, using Loop's core order and return data.
Predictions are available for most merchants. Return Predictions will begin to populate once there is approximately 6 months of continuous returns data. This may vary depending on return volume.
Model information
The forecasting model is a statistical time-series model that analyzes historical order and return data to project future return trends.
Inputs include return rate history, product mix, merchant growth trends, and seasonality patterns.
Forecast accuracy may vary for merchants with highly seasonal sales cycles or inconsistent order activity.
Orders at Risk of Return
The Orders at Risk of Return table identifies recent orders with a higher probability of being returned, based on Loop's order-level return risk model.
Columns included:
Column | Description |
|---|---|
Order ID | The unique identifier of the order. |
Order Name | The title defined by the merchant. |
Order Created Date | The date the order was created. |
Product Variant Name | The specific product variant associated with the order. |
Customer Email | Identifier of the customer who placed the order. |
Sales Channel | Channel where the order was placed. |
Was returns coverage accepted | Indicates whether return protection or coverage was accepted at checkout. |
Order Return Risk | Probability that the order will have an item returned. |
Model information
The Orders at Risk of Return table is powered by Loop's order-level return risk model, which predicts the likelihood that an individual order will result in a return.
This model is currently in its pilot phase and generates scores for a limited group of Enterprise + merchants.
How it works
The model is a Graph Neural Network (GNN)–based foundation model that evaluates relationships between orders, products, and customers to detect return patterns.
It uses data from past orders and returns, such as:
Product details (e.g., category, price, and historical return rate)
Customer behavior (e.g., prior return frequency and purchase history)
Order context (e.g., order size, shipping region, and purchase timing)
The model outputs a return risk score between 0 and 1, where a higher score indicates a higher likelihood that the order will be returned. This score may adjust over time as the models advance.
Scores are stored in Loop's internal database and surface in the dashboard once processed through the daily batch job.
Risk Assignments:
High risk = strong return-like behavior → more likely to be returned.
Medium risk = mixed indicators → possible but uncertain.
Low risk = weak signals → unlikely to be returned.
Data refresh and scope
Order-level predictions are updated daily, with results synced from Loop's machine learning environment to the Loop admin.
During this pilot phase, predictions are only available for Enterprise merchants with at least six months of historical order and return data.
Broader merchant access will follow once the foundation model's continuous prediction pipeline is live.
Accessing the dashboard
To view the dashboard in the Loop admin:
Go to Analytics > Return Prediction Dashboard.
Toggle between Predicted Item Returns and Orders at Risk of Return.
Click View Details to expand forecast data or download results.
Eligibility Criteria
Return Predictions will begin to populate once there is approximately 6 months of continuous returns data. This may vary depending on return volume.
Note: Predictions are estimates only and are intended to guide planning and forecasting. Loop recommends comparing predictions with historical performance to validate trends over time.
Tip: For additional visibility, merchants can export order-level risk data to analyze product or customer trends alongside other analytics.
FAQ
How often does the Return Prediction Dashboard update? The forecast model refreshes monthly, while the order-level risk model (currently in pilot) refreshes daily for participating merchants.
Why don't I see predictions in my dashboard? Return Predictions will begin to populate once there is approximately 6 months of continuous returns data. This may vary depending on return volume.
Can I download or export predictions? Yes. Click View Details to export data for further analysis.
Do these predictions account for seasonality? Yes. The forecasting model incorporates seasonality and product mix where data is sufficient.
Why don't the Items Returned and Value of Items Returned prediction match the Products dashboard? Both reports count line items returned and the value of the returned items but they refresh on different schedules and the views use different date logic.
Data refresh timing: The Return Prediction dashboard updates on the first of each month, while the Products dashboard updates daily. Recent returns may appear in Products first.
Date logic: The Return Prediction dashboard uses Return Submitted Date, while the Products dashboard defaults with Order Created Date.
Please reach out to support@loopreturns.com with any additional questions.